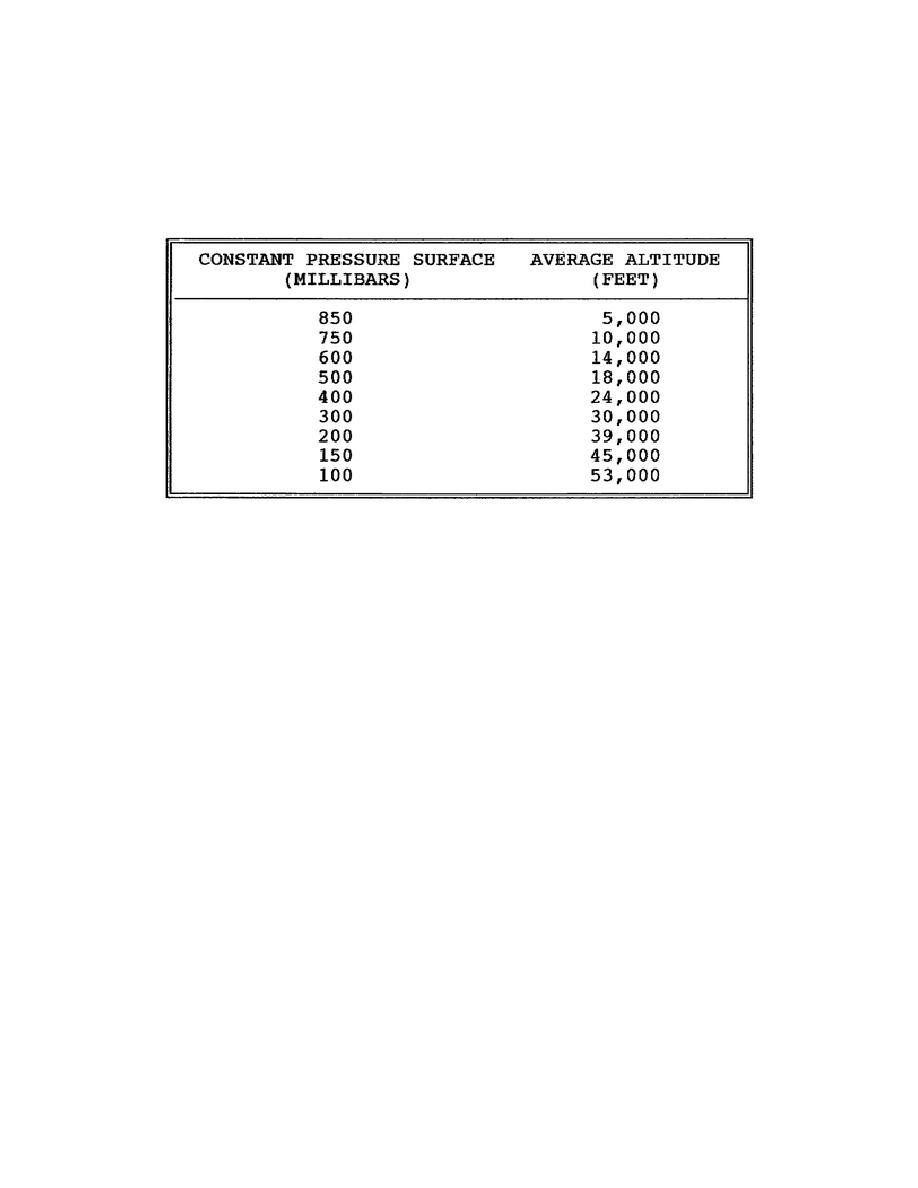
A constant pressure surface chart depicts the altitude at any location at
which a specific pressure surface will be found.
From these constant
pressure surface charts, the wind directions and speeds can be obtained for
various altitudes. Constant pressure surfaces above mean sea level (Table
2-4) are used for this purpose.
Table 2-4.
Constant Pressure Surfaces above Mean Sea Level
The wind directions obtained are reported in degrees from which the winds
are blowing, and the wind speeds are reported in knots.
PART B - USE THE FALLOUT PREDICTION PLOTTING SCALE
TO PREPARE A WIND VECTOR PLOT
In preparing the fallout wind vector plot, successive vectors for each wind
layer are laid off from the downwind end of the preceding vector, starting
with the lowest height level and working upward.
The direction of each
vector is the same as the wind direction for that layer, the length of the
vector is the product of the wind speed and a weighting factor.
The
weighting factor represents the time a nominal size fallout particle will
spend in the altitude layer of interest multiplied by the appropriate
distance conversion factor. The weighting factor is multiplied by the wind
speed in knots (nautical miles per hour) so that the vector length is in
kilometers. The wind of each vector is labeled with the height of the top
of the layer it represents, and other identifying data is added.
1.
Fallout Prediction Plotting Scale, ML-556/UM.
The plotting is facilitated by the use of a plotting scale to reduce
the
number of steps involved. Some of the operations that are eliminated
are
the conversion of the direction from which the winds are blowing to
the
direction toward which the winds are blowing and the calculation of
the
vector length.
2-7
CM5206


 Previous Page
