3.
Determination of Cloud Parameters.
Cloud parameters are read from Figure 4 on page 5 of the Supplemental
Booklet. Enter Figure 4 with the yield by placing a straightedge so that
the values on the left yield index scale and on the right yield index
scale are the same. Read all parameters under the straightedge. Cloud
parameter values are recorded on lines f through j on the worksheet.
4.
Initial Determination of Lateral Limits of the Fallout Prediction.
Mark points representing the cloud-top height cloud-bottom height and
two-thirds stem height on the fallout wind vector plot; and draw radial
lines from the ground zero point through these height points, interpolate
linearly between the wind vectors if necessary, Figure 4-2. Disregard
all wind vectors below the two-thirds stem height point and above the
cloud-top height point for the prediction being prepared.
If wind
vectors between the two-thirds stem height point and the cloud-top height
point fall outside the radial lines drawn from ground zero through these
points, expand the angle formed by these two radial lines to include
these outside wind vectors.
5.
Determination of the Effective Wind Speed.
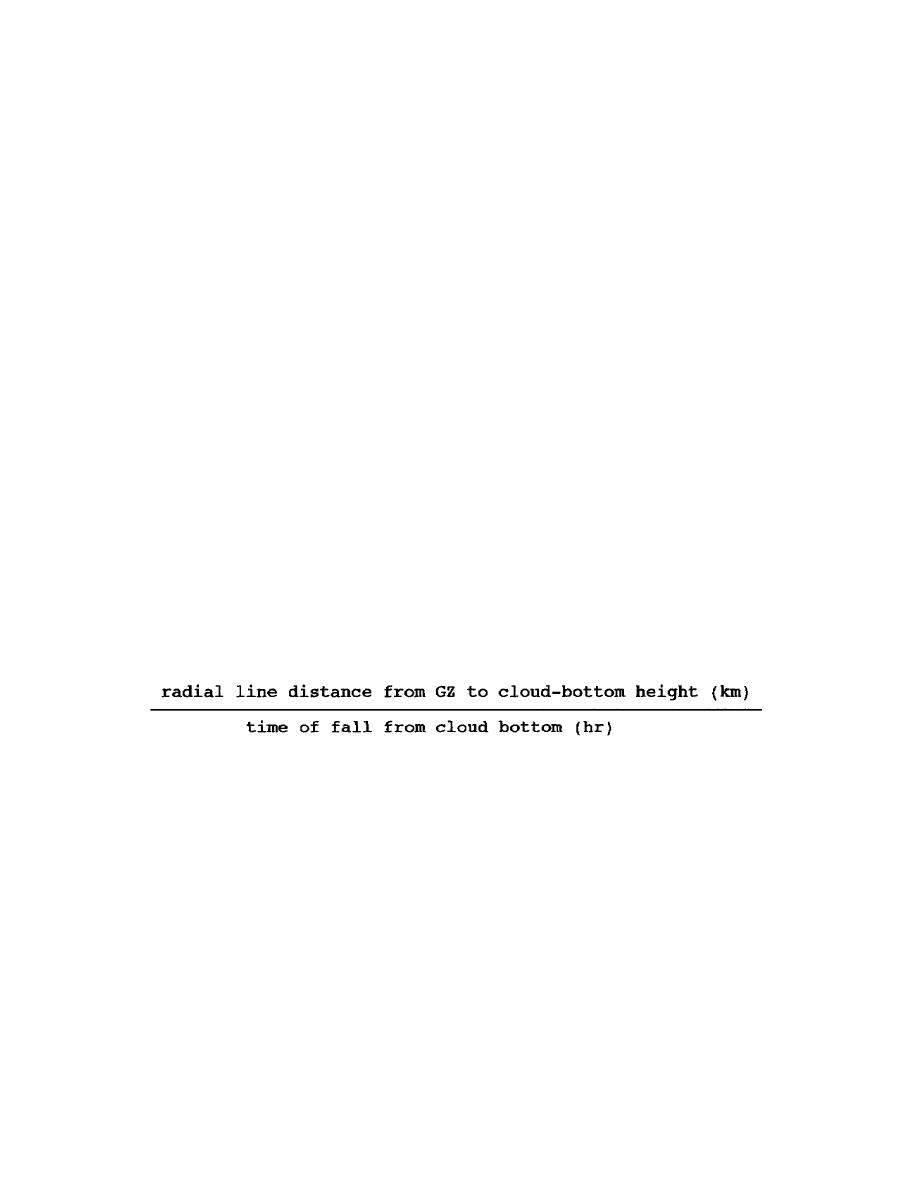
Measure the length of the radial line, in kilometers, from GZ to the
cloud-bottom height point on the wind vector plot, Figure 4-2. Record
this value on line k of the worksheet. Read the time of fall from the
cloud bottom from the worksheet, item j. Compute the effective windspeed
as shown below and record on line 1 of the worksheet. Effective wind
speed =
6.
Downwind Distances of Zones I and II.
Using Figure 7, Supplemental Booklet, align a straightedge from the yield
on the right hand scale to the value of the effective wind speed on the
left hand scale; at the intersection of the straightedge with the center
scale, read the value of the downwind distance of the Zone of Immediate
Operational Concern (Zone I) for a surface burst Record this value on
line m of the worksheet. Double the distance found above to obtain the
downwind distance of the Zone of Secondary Hazard (Zone II).
CM2307
4-4


 Previous Page
