
Lesson 2/Learning Event 1
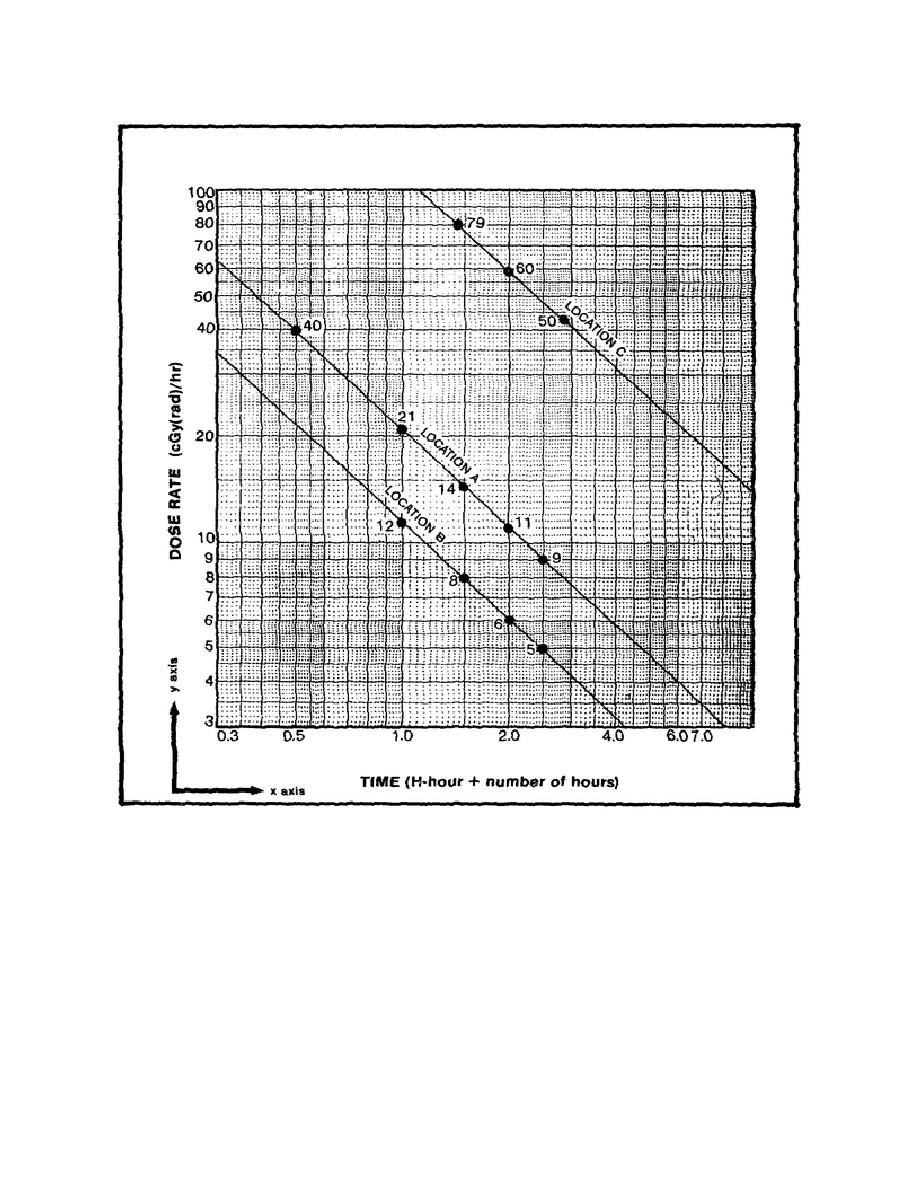
FIGURE 9. DECAY-RATE DETERMINATION
(MONITORING READING PLOT).
NOTE
This is an example to demonstrate a procedure. In actual practice,
the points are not likely to fall exactly on a straight line as in figures 9
and 10. In actual practice, the best straight line is fitted to the points.
A linear scale superimposed on the graph as illustrated in figure 10 can be used to show the
determination of linear measurements.
38

 Previous Page
