
Lesson 2/Learning Event 1
the monitoring time interval. For example, a decay rate determined from monitoring readings taken
between H + 4 and H + 8 can be used to determine dose rates at H + 8 and on up to H + 20 (TP = H + 8
+ 3(8-4) = H = 20).
EXAMPLE: Consider a fallout-producing nuclear burst (H-hour known) with the collection effort
initiated at H + 4 and expected to be completed by H + 6; the target time for preparation of the pattern is
H + 8. By H + 4 to H + 6, a decay estimation can be made and used to process the remainder of the
dose-rate information from the collection effort. This procedure will result in a reasonably reliable H +
1 pattern. By H + 6, a decay-rate determination can be accomplished which will allow use of the
resulting pattern until about H + 12. By H + 12, a decay-rate determination can be accomplished which
will allow use of the pattern until H + 36 hours.
Graphical Method for Determination of n. When a series of dose rates from one location is plotted on
log-log graph paper, the decay rate of the contamination will cause the line plotted to be a straight line,
inclined at a slope (n) to the axes of the graph.
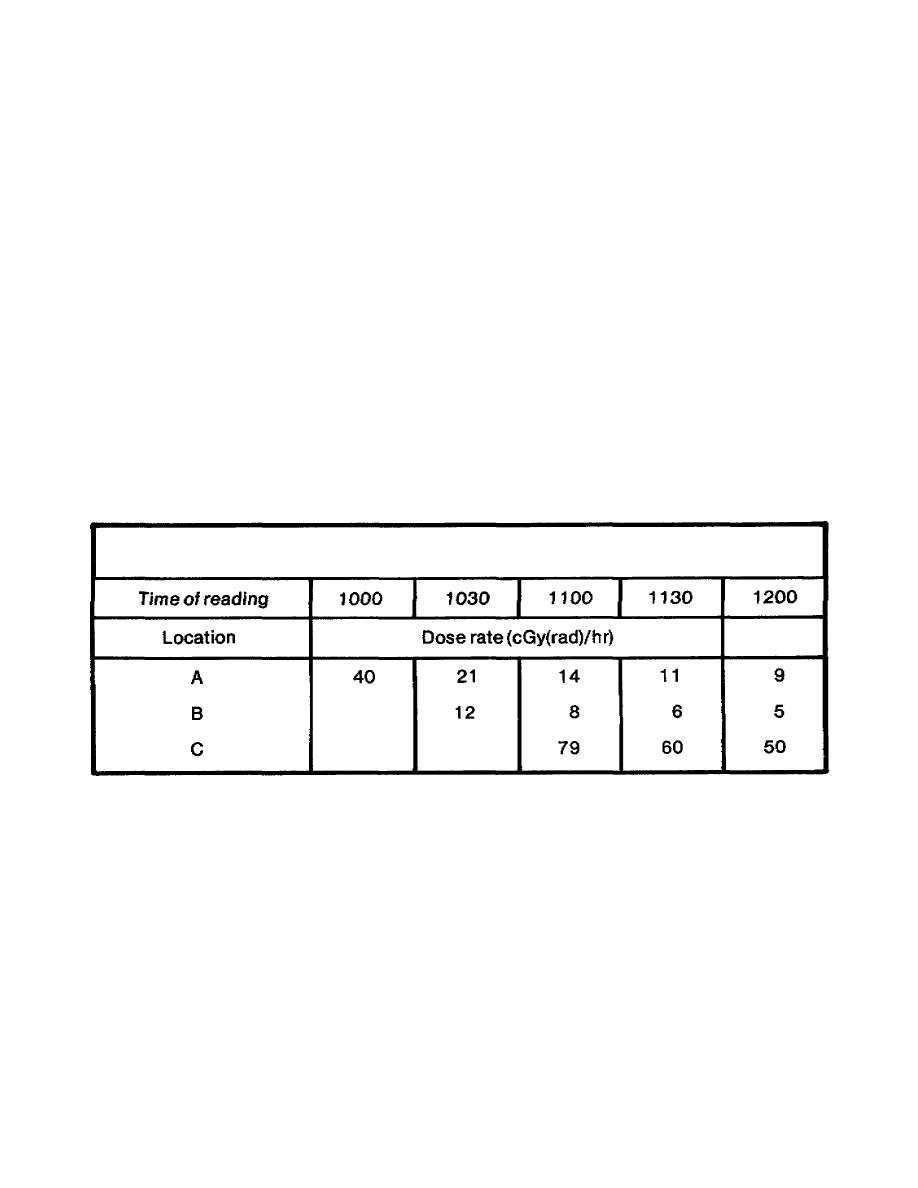
EXAMPLE: Suppose the set of readings shown below in figure 8 is received for decay-rate
determination; H-hour is known or determined to be 0930 hours.
FIGURE 8. DOSE-RATE READINGS.
These data are plotted on log-log graph paper, using the time as the number of hours past H-hour and the
best possible set of three lines is drawn through the points. When these plots are made, the graph shown
in figure 9 on page 38 is obtained. The slope of the three parallel lines is n, the decay exponent.
37

 Previous Page
