Step 2.
Attach overlay paper to a piece of graph paper, a map, a firing
chart, or any other paper with a set of parallel lines that can
serve as north-south grid lines, select and mark a point which
represents ground zero, and draw in and label a grid north line.
Step 3.
Select and record a map scale.
(In this example, a map scale of
1:500,000 will be used.)
Step 4.
Plot the wind direction and vector length for each wind layer,
starting with the lowest layer.
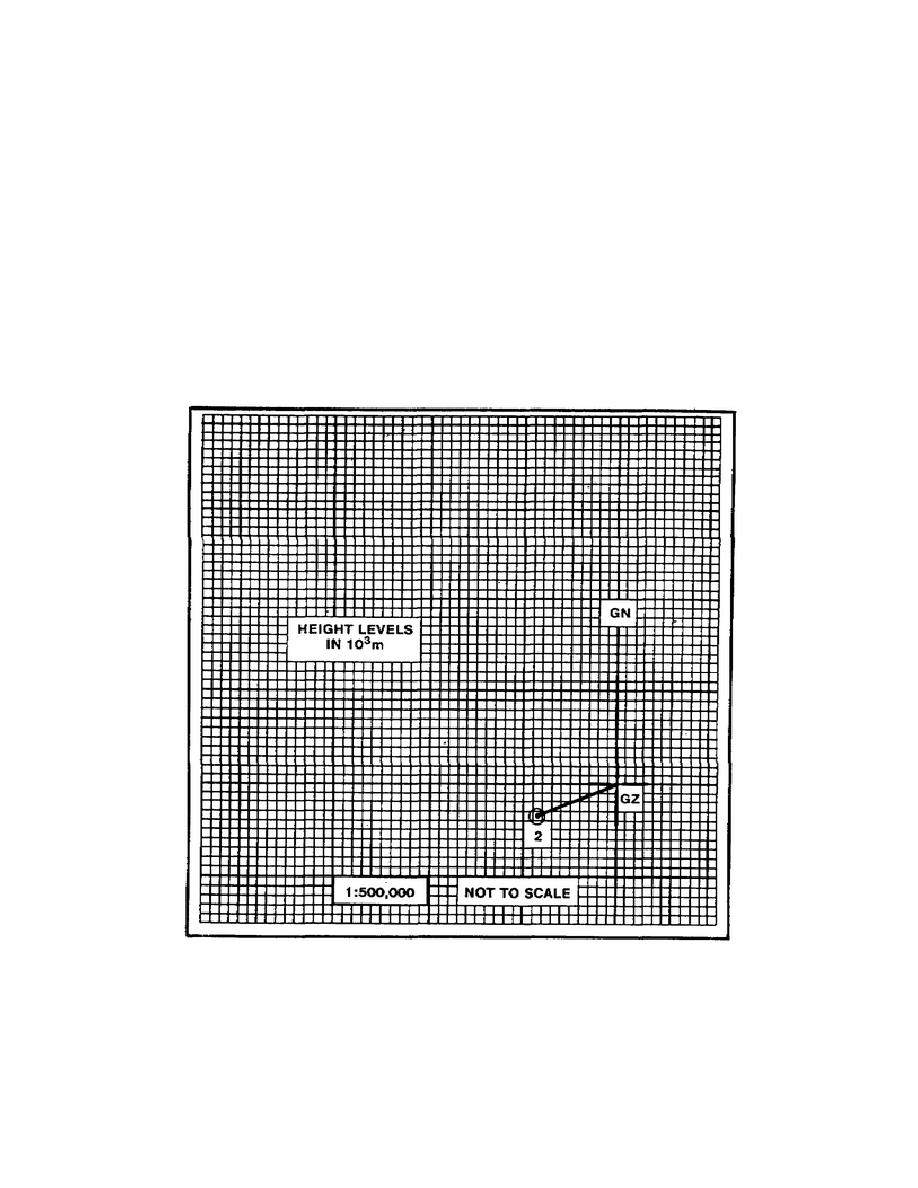
a. Plot the vector for the lowest (0 to 2,000 meter) wind
layer which
represents a wind with a speed of 9 knots blowing from
1,240 mils.
From GZ, plot a line toward 4440 mils 11.3 kilometers
long. Mark
the end of this vector with the number 2 to indicate
2,000 meter
height and add a small circle (Figure 2-6).
Figure 2-6. Preparation of Wind Vector Plot
from Field Artillery Upper Air Wind Data (Example Problem)
CM5206
2-20


 Previous Page
